import numpy as np
import matplotlib.pyplot as plt
import librosa
y1, sr = librosa.load("smooth.mp3")
hop = 512
chroma = librosa.feature.chroma_cqt(y=y1, hop_length=hop)
plt.figure(figsize=(12, 3))
img = librosa.display.specshow(chroma, hop_length=hop, y_axis='chroma', x_axis='time', ax=plt.gca())
plt.title("Smooth Criminal: Michael Jackson")
Text(0.5, 1.0, 'Smooth Criminal: Michael Jackson')
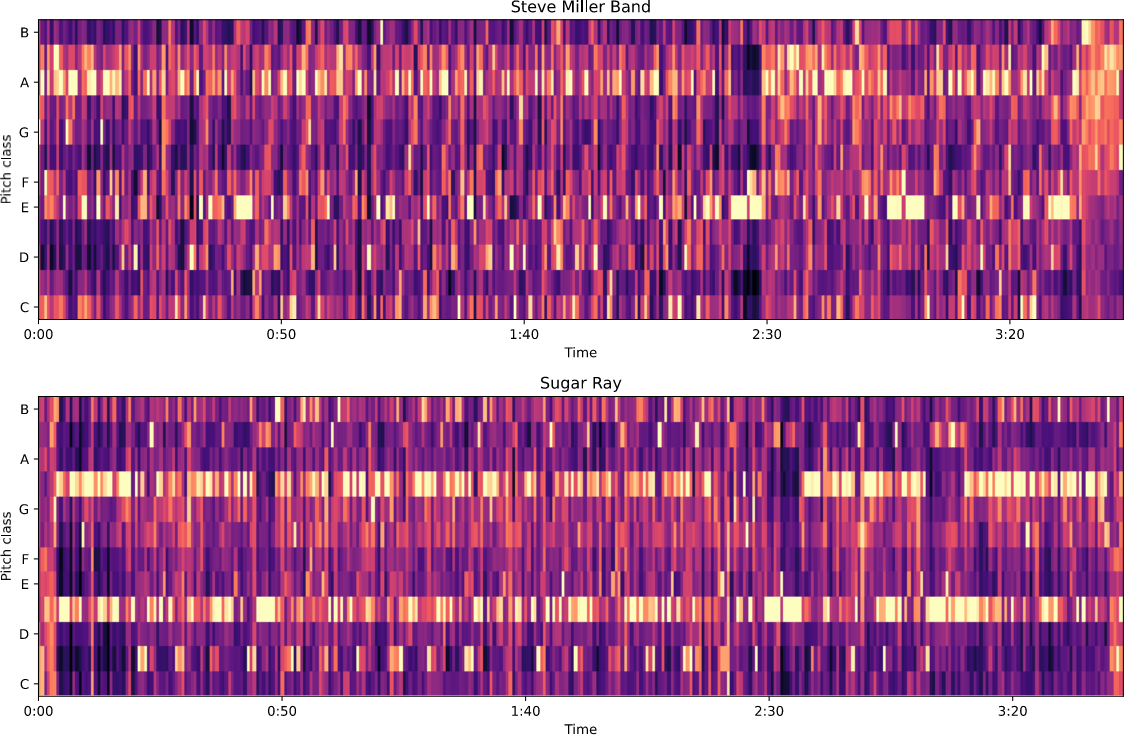
y2, sr = librosa.load("aliensmooth.mp3")
hop = 512
chroma2 = librosa.feature.chroma_cqt(y=y2, hop_length=hop)
plt.figure(figsize=(12, 3))
img = librosa.display.specshow(chroma2, hop_length=hop, y_axis='chroma', x_axis='time', ax=plt.gca())
plt.title("Smooth Criminal: Alien Ant Farm")
Text(0.5, 1.0, 'Smooth Criminal: Alien Ant Farm')
First, we make a method that takes in a chromagram (chroma spectrogram) $X$ with $M$ columns and which computes an $M \times M$ array $D$ where
This can be implemented efficiently with a matrix multiplication after each column is normalized, as shown in the picture below:
def get_ssm_slow(X):
M = X.shape[1]
D = np.zeros((M, M))
for i in range(M):
Xi = X[:, i]
Xi = Xi / np.sqrt(np.sum(Xi**2)) # Loudness normalization
for j in range(M):
Xj = X[:, j]
Xj = Xj/np.sqrt(np.sum(Xj**2))
D[i, j] = np.sum(Xi*Xj)
def get_ssm(C):
"""
A faster method that uses matrix multiplication
"""
# Normalize each column
CNorm = np.sqrt(np.sum(C**2, axis=0))
C = C/CNorm[None, :]
return np.dot(C.T, C)
D = get_ssm(chroma)
plt.imshow(D, cmap='magma')
plt.colorbar()
<matplotlib.colorbar.Colorbar at 0x7f40285620a0>
Create a method that replaces a $12 x M$ chromagram $C$ by a $12 x (M/f)$ chromagram $C_f$, in which each column of $C_f$ is the average of $f$ contiguous columns in $C$
def chunk_average(C, f):
"""
Replace a chromagram C with a chromagram where we
replace each chunk of f columns by the average
"""
C2 = np.zeros((C.shape[0], C.shape[1]//f))
for j in range(C2.shape[1]):
C2[:, j] = np.mean(C[:, j*f:(j+1)*f], axis=1)
return C2
f = 43
row_samples = f*hop
print(row_samples/sr)
D = get_ssm(chunk_average(chroma, f))
plt.figure()
plt.imshow(D, cmap='magma')
plt.colorbar()
0.9984580498866213
<matplotlib.colorbar.Colorbar at 0x7f40284b2e80>
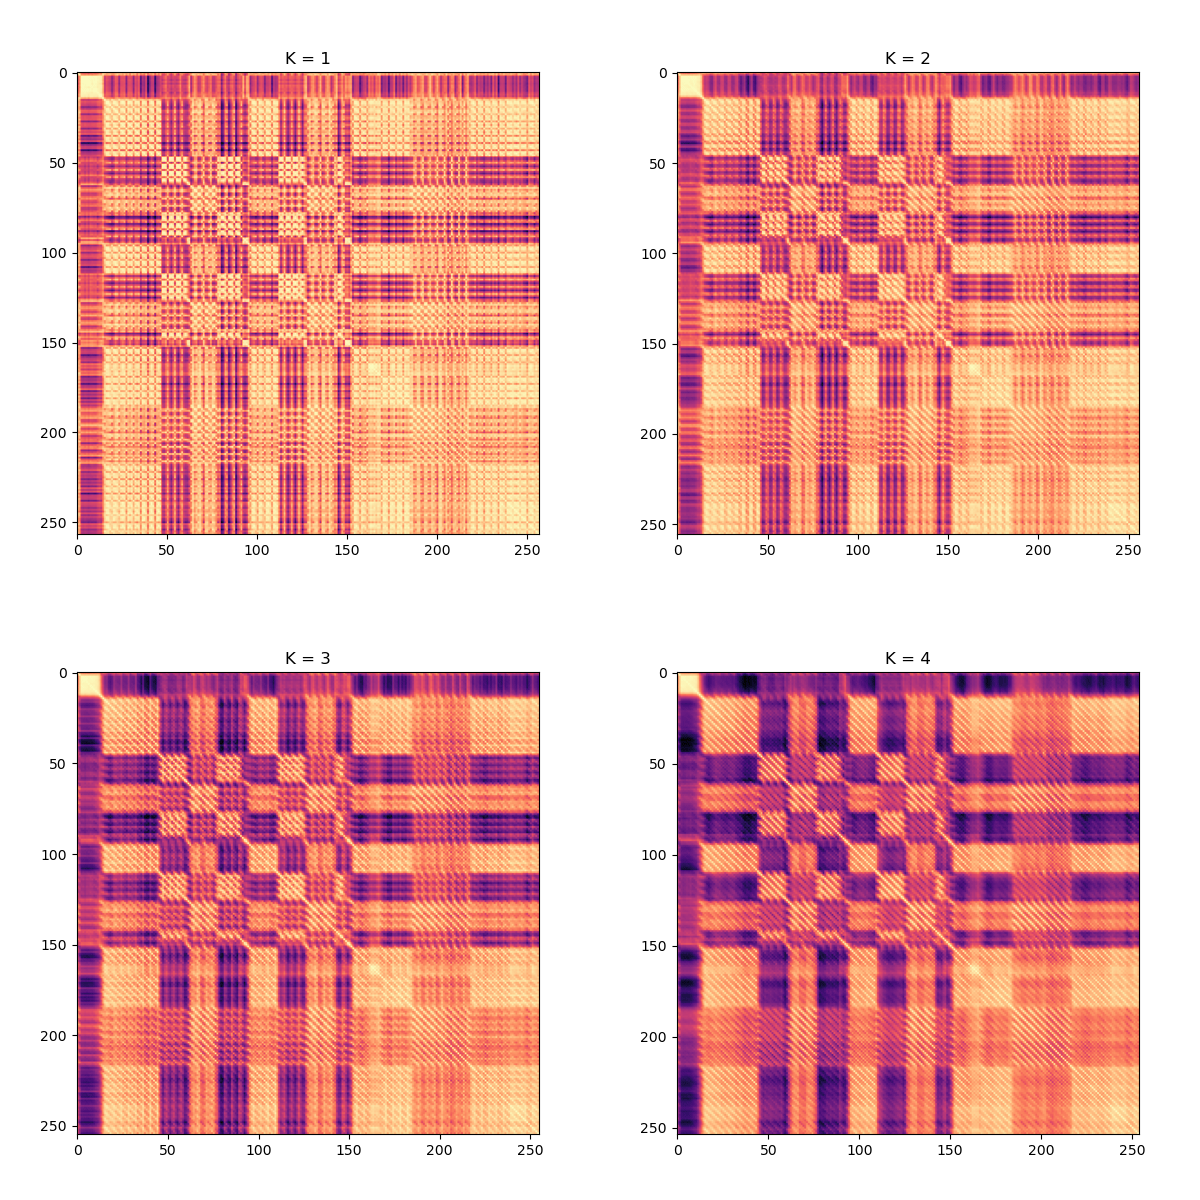
Here is a slow way to do diagonal enhancement directly from the definition
def diagonally_enhance(D, K):
M = D.shape[0]-K+1
S = np.zeros((M, M))
# O(M*M*K)
for i in range(M):
for j in range(M):
avg = 0
for k in range(K):
avg += D[i+k, j+k]
S[i, j] = avg/K
return S
plt.figure(figsize=(6, 6))
k = 4
DDiag = diagonally_enhance(D, k)
plt.clf()
plt.imshow(DDiag, cmap='magma')
plt.title("K = {}".format(k))
Text(0.5, 1.0, 'K = 4')
Here is a fast way to do diagonal enhancement by using cumulative sums
# Take out a diagonal from the matrix
k = 4
d = np.diag(D, 50)
plt.plot(d)
"""
## Slow way
d2 = np.zeros(len(d)-k+1)
for i in range(len(d2)):
d2[i] = np.mean(d[i:i+k])
"""
# Sliding window average (much faster than doing the average directly)
d = np.concatenate(([0], d))
dsum = np.cumsum(d)
d2 = (dsum[k::] - dsum[0:-k])/k
plt.plot(d2)
plt.legend(["Original", "Diagonal Average"])
<matplotlib.legend.Legend at 0x7f40283a6c70>
def diagonally_enhance(D, K):
M = D.shape[0]-K+1
S = np.zeros((M, M))
# Loop through every diagonal of D
i = M-1
j = 0
for diag in range(-M+1, M): # Go from -M+1 (lower left diag) to M-1 (upper right diagonal)
# Extract diagonal from matrix
d = np.diag(D, diag)
# Perform fast cumulative sum averaging
d = np.concatenate(([0], d))
dsum = np.cumsum(d)
d2 = (dsum[k::] - dsum[0:-k])/k
# Put result d2 into the appropriate diagonal in the matrix S
S[i+np.arange(len(d2)), j+np.arange(len(d2))] = d2
if i == 0:
# In upper triangle; move to next column to start
j = j + 1
else:
# Still in lower triangle; move the start up one row
i = i-1
return S
k = 4
DDiag = diagonally_enhance(D, k)
plt.clf()
plt.imshow(DDiag, cmap='magma')
plt.title("K = {}".format(k))
Text(0.5, 1.0, 'K = 4')