First, we create methods for generating square waves and sawtooth waves. We're careful to oversample and lowpass filter before downsampling to our desired sample rate to avoid aliasing. We have to be particularly careful with this, because we're going to be using a low sample rate of 8000hz to reduce the number of parameters that our models needs to tweak
import numpy as np
import matplotlib.pyplot as plt
import IPython.display as ipd
import torch
from torch import nn
from torch.utils.data import Dataset, DataLoader
from scipy import signal
def get_square(A, f, phi, sr, N, fac=10):
# Compute antialiased square wave
t = np.arange(N*fac)/(sr*fac)
y = A*np.sign(np.cos(2*np.pi*f*t + phi))
if fac > 1:
# Antialias
b, a = signal.butter(8, 1/fac)
y = signal.filtfilt(b, a, y)
y = y[0::fac]
return y
def get_sawtooth(A, f, phi, sr, N, fac=10):
T = sr*fac/f
y = (np.arange(N*fac) + phi*T/(2*np.pi)) % T
y = y/np.max(y)
y = A*2*(y-0.5)
if fac > 1:
# Antialias
b, a = signal.butter(8, 1/fac)
y = signal.filtfilt(b, a, y)
y = y[0::fac]
return y
sr = 8000
y1 = get_sawtooth(2, 880, 0.5, sr, sr, fac=10)
y2 = get_square(2, 880, 0.5, sr, sr, fac=10)
plt.subplot(211)
plt.plot(y1[0:200])
plt.plot(y2[0:200])
plt.subplot(212)
plt.plot(np.abs(np.fft.fft(y1)))
plt.plot(np.abs(np.fft.fft(y2)), linestyle='--')
ipd.Audio(y1, rate=sr)
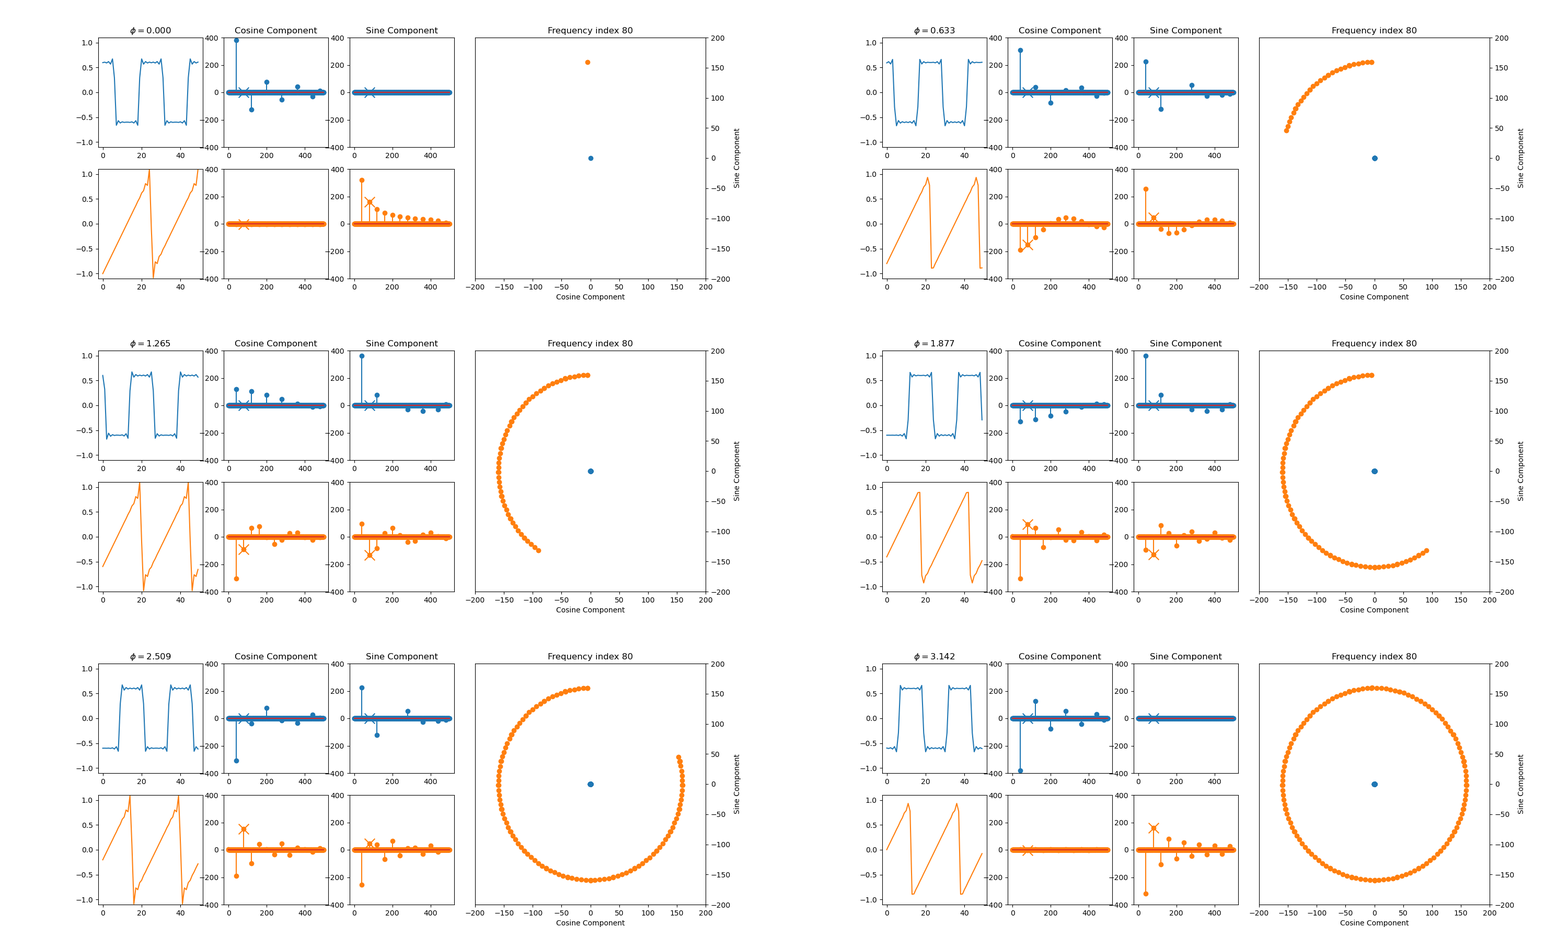
We note that a set of audio clips is linearly separable in its audio coordinate space if and only if it is linearly separable in the cosine/sine non-redundant DFT space. When we transform to the sine/cosine DFT space, we see what the problem is. We would have to separate the point at the origin from the annulus around it. So this dataset is not linearly separable
Below is the code I wrote to generate the above animation
sr = 8000 # Sample rate
N = 1000 # Number of audio samples per clip
n_frames = 150
fac = 1
plt.figure(figsize=(fac*15, fac*6))
T = 25 # Period
f = sr//25
idx = 2*f*N//sr
cidx1 = []
sidx1 = []
cidx2 = []
sidx2 = []
ylims = [-400, 400]
for i, phi in enumerate(np.linspace(0, np.pi, n_frames)):
plt.clf()
y1 = 0.6*get_square(1, f, phi, sr, N)
f1 = np.fft.fft(y1)[0:N//2]
y2 = get_sawtooth(1, f, phi, sr, N)
f2 = np.fft.fft(y2)[0:N//2]
cidx1.append(np.real(f1)[idx])
sidx1.append(np.imag(f1)[idx])
cidx2.append(np.real(f2)[idx])
sidx2.append(np.imag(f2)[idx])
plt.subplot(251)
plt.plot(y1[0:50])
plt.title("$\\phi = {:.3f}$".format(phi))
plt.ylim([-1.1, 1.1])
plt.subplot(252)
plt.stem(np.real(f1))
plt.scatter(idx, cidx1[-1], s=200, c='C0', marker='x')
plt.ylim(ylims)
plt.title("Cosine Component")
plt.subplot(253)
plt.stem(np.imag(f1))
plt.scatter(idx, sidx1[-1], s=200, c='C0', marker='x')
plt.ylim(ylims)
plt.title("Sine Component")
plt.subplot(256)
plt.plot(y2[0:50], c='C1')
plt.ylim([-1.1, 1.1])
plt.subplot(257)
markerline, stemlines, baseline = plt.stem(np.real(f2))
plt.setp(markerline, 'color', 'C1')
plt.setp(stemlines, 'color', 'C1')
plt.scatter(idx, cidx2[-1], s=200, c='C1', marker='x')
plt.ylim(ylims)
plt.subplot(258)
markerline, stemlines, baseline = plt.stem(np.imag(f2))
plt.setp(markerline, 'color', 'C1')
plt.setp(stemlines, 'color', 'C1')
plt.scatter(idx, sidx2[-1], s=200, c='C1', marker='x')
plt.ylim(ylims)
plt.subplot2grid((2, 5), (0, 3), rowspan=2, colspan=2)
plt.scatter(cidx1, sidx1)
plt.scatter(cidx2, sidx2)
plt.xlim(-200, 200)
plt.ylim(-200, 200)
plt.title("Frequency index {}".format(idx))
plt.xlabel("Cosine Component")
plt.ylabel("Sine Component")
plt.gca().yaxis.set_label_position("right")
plt.gca().yaxis.tick_right()
plt.savefig("shift{}.png".format(i))
<Figure size 1500x600 with 0 Axes>
To make this linearly separable, we'll replace the input array with the magnitude of its fourier transform. This throws away the phase as a nuisance parameter
class SquareSawtooth(Dataset):
def __init__(self, n_examples, pmin, pmax, sr, N, snr=10, do_fft=False):
"""
Parameters
----------
n_examples: int
Number of examples per epoch
pmin: int
Minimum note number
pmax: int
Maximum note number
sr: int
Sample rate
N: int
Number of samples per example
snr: float
Signal to noise ratio
"""
# Create randomized fixed notes
self.pmin = pmin
self.pmax = pmax
self.snr = snr
self.sr = sr
self.N = N
self.n_examples = n_examples
self.do_fft = do_fft
def __len__(self):
return self.n_examples
def __getitem__(self, idx):
## If the sample index is even, generate a random square wave with label 0
## If the sample index is off, generate a random sawtooth wave with label 1
y = idx % 2
A = np.random.randn()
phi = 2*np.pi*np.random.rand()
f = 440*2**(np.random.randint(self.pmin, self.pmax+1)/12)
if y == 0:
x = get_square(A, f, phi,self.sr, self.N, fac=10)
x += A*np.random.randn(x.size)/self.snr
else:
x = get_sawtooth(A, f, phi,self.sr, self.N, fac=10)
x += A*np.random.randn(x.size)/self.snr
if self.do_fft:
# Throw away the phase
x = np.abs(np.fft.fft(x))
x = torch.from_numpy(np.array(x, dtype=np.float32))
y = torch.from_numpy(np.array(y, dtype=np.float32))
return x, y
device = torch.device('cuda' if torch.cuda.is_available() else 'cpu')
print("Device", device)
sr = 8000 # Sample rate
N = 1000 # Number of audio samples per clip
p1 = 0
p2 = 0
data = SquareSawtooth(1000, p1, p2, sr, N, snr=10, do_fft=True)
Device cuda
## TODO: Setup a perceptron of the right dimension
perceptron = nn.Linear(N, 1)
perceptron = perceptron.to(device)
optimizer = torch.optim.Adam(perceptron.parameters(), lr=1e-2)
loss_fn = torch.nn.BCEWithLogitsLoss()
n_epochs = 50
losses = []
accuracy = []
plt.figure(figsize=(12, 6))
for epoch in range(n_epochs):
loader = DataLoader(data, batch_size=32, shuffle=True)
total_loss = 0
total_correct = 0
for i, (X, Y) in enumerate(loader):
X = X.to(device)
Y = Y.to(device)
optimizer.zero_grad()
Y_est = perceptron(X) # Run model on inputs
loss = loss_fn(Y_est[:, 0], Y) # Compute loss function
loss.backward() # Compute gradient of loss function wrt model parameters
optimizer.step() # Update the parameters according to the gradient
loss = loss.item()
total_loss += loss
Y_est = 0.5*(torch.sign(Y_est[:, 0]) + 1) # 1 if estimate is 1, 0 otherwise
total_correct += torch.sum(Y_est == Y)
a = total_correct.cpu().detach()/len(data)
losses.append(loss)
accuracy.append(a)
#print("Epoch {}, loss = {:.3f}, accuracy={:.3f}".format(epoch, loss, a))
<Figure size 1200x600 with 0 Axes>
## Plot the results of training
plt.figure(figsize=(10, 5))
plt.subplot(211)
plt.plot(losses)
plt.title("Losses")
plt.xlabel("Epoch Number")
plt.ylabel("Loss")
plt.subplot(212)
plt.plot(accuracy)
plt.title("Accuracy")
plt.xlabel("Epoch Number")
plt.ylabel("Loss")
plt.tight_layout()
Recall that the input to the logistic function is
We want this to be negative for a square wave and positive for a sawtooth wave. The training learns that if it makes the coefficients in front of the frequencies that they both have in common to be negative, and the frequencies in front of the coefficients that only the sawtooth wave has, then it works! And we didn't even tell it that these FFTs had equally spaced harmonics, let alone that the sawtooth wave had more than the square wave!
# 0 is square
# 1 is sawtooth
x0 = data[0][0]
x1 = data[1][0]
p, b = list(perceptron.parameters())
p = p.cpu().detach().flatten()
b = b.cpu().detach().flatten()
print("bias", b)
plt.figure(figsize=(12, 6))
plt.subplot(311)
plt.plot(x0, c='C0')
plt.title("Square Wave Example")
plt.subplot(312)
plt.plot(x1, c='C1')
plt.title("Sawtooth Wave Example")
plt.subplot(313)
plt.plot(p, c='C2')
plt.plot(np.zeros(len(p)), c='k', linewidth=2)
plt.title("Logistic Coefficients")
plt.tight_layout()
bias tensor([0.1371])